Data Collection and Analysis Tools in Lean Six Sigma

Introduction
Lean Six Sigma (LSS) is a methodology focused on enhancing business processes by minimizing waste and variability. At its core, LSS combines Lean principles for waste reduction with Six Sigma’s emphasis on quality improvement, using robust data collection and analysis tools. These tools are essential for identifying inefficiencies, optimizing processes, and driving continuous improvement.
Ready to elevate your Lean Six Sigma expertise? Explore VERSAtile Reads’ Six Sigma Certification Resources in terms of Exam Cram Essentials and Practice Questions. Visit VERSAtile Reads today and take the next step toward becoming a certified LSS professional!
The Role of Data Collection and Analysis in Lean Six Sigma
Why Data Collection Matters
Data collection is the foundation of Lean Six Sigma projects. Identifying root causes, measuring process performance, and making informed decisions without accurate data becomes challenging. Key benefits of data collection include:
- Understanding current process capabilities.
- Identifying trends, bottlenecks, and outliers.
- Establishing a baseline for improvement efforts.
Importance of Analysis in LSS
Analysis transforms raw data into actionable insights. Lean Six Sigma practitioners rely on statistical and analytical tools to:
- Validate hypotheses about process inefficiencies.
- Quantify the impact of implemented changes.
- Predict outcomes and ensure sustainability.
- Key Data Collection Tools in Lean Six Sigma
- Check Sheets
A check sheet is a simple yet powerful tool for collecting data in a structured manner. It allows teams to:
- Record frequencies of specific events or defects.
- Identify patterns over time.
Example: A manufacturing team can use a check sheet to track defective parts per shift.
- Surveys and Questionnaires
Surveys effectively gather qualitative data from employees, customers, or stakeholders. Key considerations include:
- Designing unbiased and relevant questions.
- Ensuring anonymity to encourage honest responses.
- Pareto Chart
The Pareto Chart combines bar and line graphs to identify the most significant factors in a process. It follows the 80/20 rule, highlighting that 80% of problems often arise from 20% of causes.
Example: A hospital uses a Pareto Chart to determine that 80% of patient delays are caused by 20% of administrative bottlenecks.
- Sampling Methods
Sampling involves collecting a representative subset of data to make inferences about the larger process. Popular sampling techniques include:
- Random Sampling: Selecting data points at random to avoid bias.
- Stratified Sampling: Dividing data into subgroups for targeted analysis.
- Time Studies
Time studies measure the duration of specific tasks or processes, providing insights into bottlenecks and inefficiencies.
Example: A restaurant uses time studies to analyze the time taken for food preparation during peak hours.
Key Data Analysis Tools in Lean Six Sigma
-
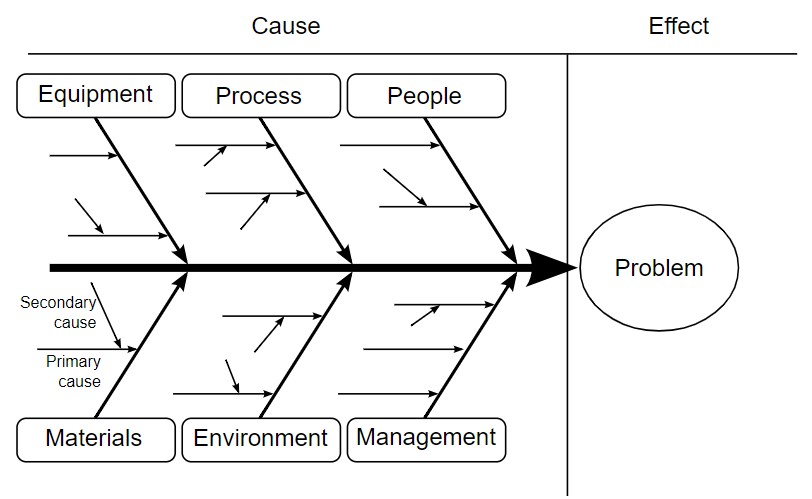
Cause-and-Effect Diagram (Fishbone Diagram)
The Fishbone Diagram helps teams systematically identify potential causes of a problem. Categories often include:
- Manpower
- Materials
- Methods
- Machines
Example: A software team uses this diagram to investigate the root causes of frequent application crashes.

-
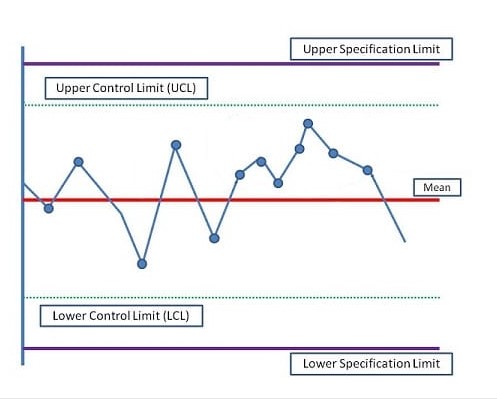
Control Charts
Control charts are used to monitor process stability over time. They help differentiate between common cause variations (inherent to the process) and special cause variations (unexpected deviations).
Key Metrics
- Upper Control Limit (UCL)
- Lower Control Limit (LCL)

-
Histogram
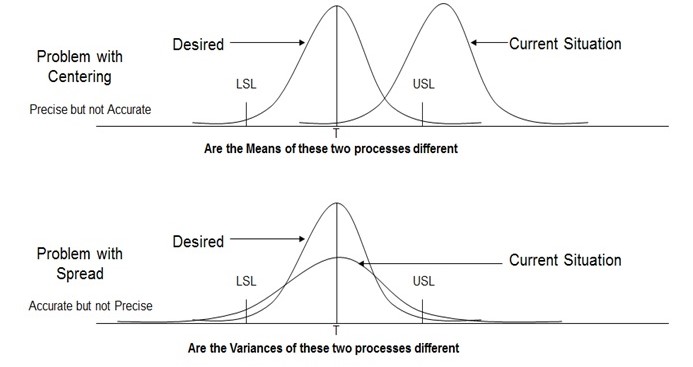
A histogram visually represents data distribution, helping teams understand process variability and identify trends.
Example: An education firm uses histograms to evaluate test score distributions across multiple training programs.

-
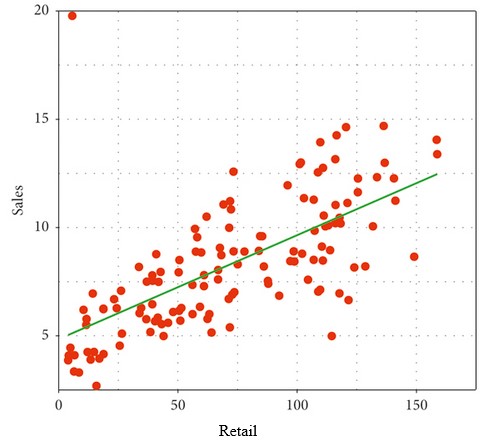
Regression Analysis
Regression analysis explores relationships between variables, allowing teams to predict outcomes and optimize processes.
Types of Regression:
- Linear Regression
- Multiple Regression
Example: A retail business analyzes the impact of promotional campaigns on sales through regression analysis.

-
Failure Mode and Effects Analysis (FMEA)
FMEA is a proactive tool for identifying potential failure points in a process and prioritizing them based on the following:
- Severity
- Occurrence
- Detection

-
Hypothesis Testing
Hypothesis testing helps teams validate assumptions about process improvements. Common tests include:
- t-test: Compares means between two groups.
- ANOVA: Compares means among three or more groups.
Example: A logistics company uses hypothesis testing to confirm if implementing automation reduces delivery times.

Integrated Use of Data Collection and Analysis
Lean Six Sigma practitioners often combine tools for deeper insights. For instance:
- Data from check sheets can feed into Pareto Charts to prioritize issues.
- Histograms can complement Control Charts to monitor variations over time.
Real-World Applications
Healthcare
Hospitals use Lean Six Sigma tools to reduce patient wait times and improve treatment outcomes. Control charts and time studies are commonly employed.
Manufacturing
Manufacturers use tools like FMEA and Pareto Charts to minimize defects and enhance product quality.
Retail
Retailers utilize surveys and regression analysis to improve customer satisfaction and forecast demand.
Challenges in Data Collection and Analysis
- Data Integrity Ensuring accurate, complete, and unbiased data is a critical challenge.
- Choosing the right tool for the problem requires expertise.
- Scalability Large datasets may necessitate advanced tools like machine learning and big data analytics.
Conclusion
Data collection and analysis tools are at the heart of Lean Six Sigma’s success. Organizations can achieve measurable improvements in quality, efficiency, and customer satisfaction by leveraging tools like check sheets, control charts, and regression analysis.
Whether you’re looking to enhance your business processes or gain certifications in Lean Six Sigma, VERSAtile Reads offers resources to guide you through every step of your journey. From comprehensive training programs to insightful blogs, VERSAtile Reads equips you with the knowledge to excel in Lean Six Sigma and beyond.
FAQs
-
What is the importance of data collection in Lean Six Sigma?
Data collection is crucial in Lean Six Sigma as it provides a clear understanding of current processes, identifies inefficiencies, and establishes a baseline for improvement. Accurate data ensures that decisions are evidence-based, reducing the likelihood of errors and enabling teams to focus on addressing root causes rather than symptoms.
-
Which data analysis tool best identifies root causes in Lean Six Sigma?
The Cause-and-Effect Diagram (Fishbone Diagram) is one of the best tools for identifying root causes. It helps teams systematically explore all possible factors contributing to a problem, making pinpointing and addressing the underlying issues easier.
-
How can we ensure the effective use of Lean Six Sigma data tools in our organization?
To effectively use Lean Six Sigma tools, organizations should:
- Invest in training their teams in Lean Six Sigma methodologies.
- Use software solutions to automate data collection and analysis where possible.
- Published Date:


